
Introduction
Nowadays it is hard to imagine our lives without movies. They have the ability to portray a snapshot of reality and show it to people that could never have seen it otherwise. However, within their realities, movies are often criticized for not accurately representing the population. For example, historically, it is often said that women are vastly underrepresented.
The goal of this project is to look at gender diversity in movies over time and see how it influences a movie's success using the CMU Movie Summary Corpus.
Not a data scientist? Don't worry! We have added some purple boxes with explanations along the way to help you out.
How many Female Characters are There?
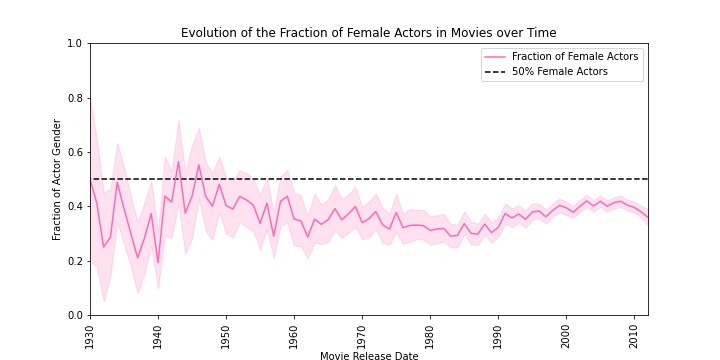
The average fraction of women in the over 40'000 movies in the CMU Movie Summary Corpus is 39%. That sounds reasonably close to 50%, right? However, since the dataset was extracted from English language Wikipedia, movies in English logically make up the majority of it. We took a look at the percentage of women in only the movies in the English language. We have only 35% of female actors in that group!
What is the CMU Movie Summary Corpus?
The CMU Movie Summary Corpus consists of 42,306 movie plot summaries extracted from the November 2, 2012, dump of English-language Wikipedia. It was then coupled with data from the November 4, 2012, dump of Freebase to add metadata on the movie and information on the actors.
That's just because of old movies right?
Wrong !
As can be seen in the graph on the right the fraction of female actors has been relatively constant over the years, only climbing above 50% during WWII.
Wait, there is more !
From Gender Gap to Age Gap
We have all seen movie couples that have huge age gaps in the people portraying them. But are actresses also younger overall?
Yes !
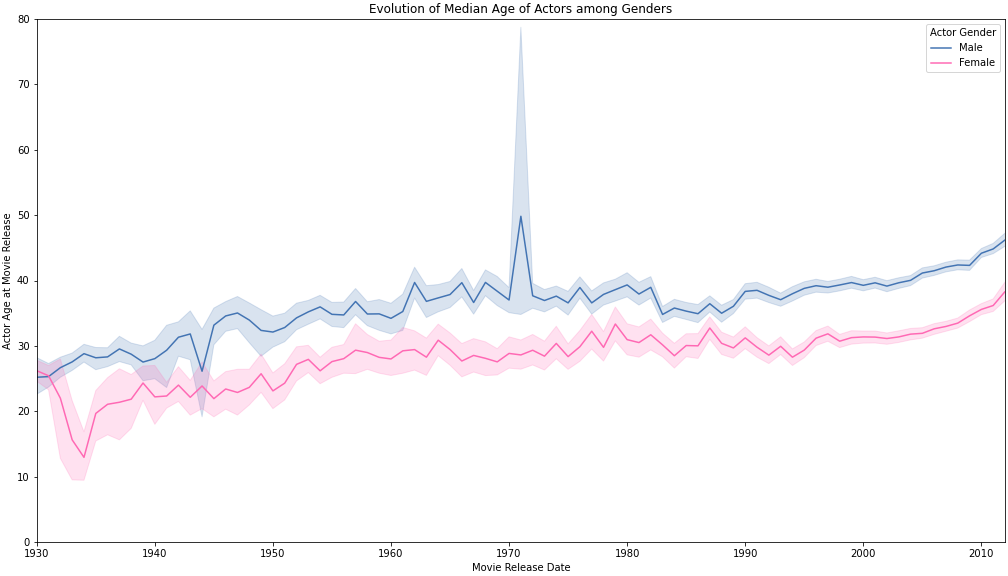
On average female actors are about 25 years old whereas male actors are closer to 35. As can be seen in the graph on the left, actresses are consistently about 10 years younger than actors over the timespan of the data.
Is this surprising, George ?
Take a minute to gather all the most attractive men and women you can think of. In general, the men were much older, weren't they ?

Romance Films for Women, Action Movies for Men
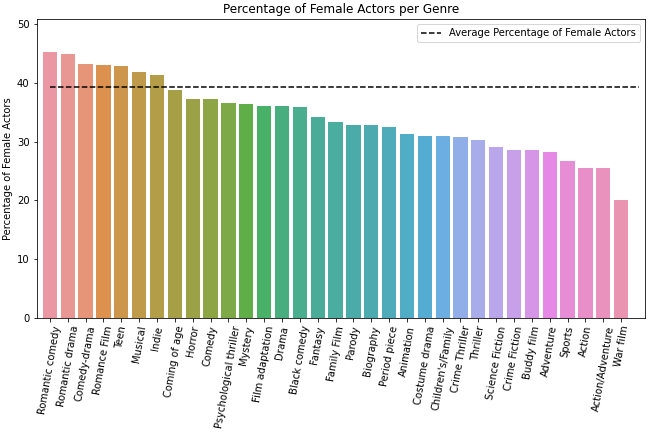
Here we can see that women make up the minority of characters across the genres that have more than 800 actors in them. Most interestingly, of the five most represented genres in our dataset: Drama, Comedy, Romance Film, Thriller and Action, women make up more than 40% of the cast in only one: Romance (43%). Notice that the fraction of actresses is much higher in movies that are traditionally targeted at women (like Romance Films) in general when compared to more traditionally masculine genres like Action Movies where the fraction of actresses is a measly 25.5%.
How are the genders portrayed ?
We have seen that men and women are present in different numbers on screen, but how are they described ?
First, we will look into the positivity of mentions in the movie summaries by performing a sentiment analysis. This works by finding the sentences that are associated with men or women and then counting the number of positive, negative or neutral words that are associated with them. Below you can see a part of the movie summary of Cinderella with the male sentences highlighted in blue and the female sentences highlighted in pink. The words that are marked in blue/pink are the ones that were used to determine whether a sentence is male or female. These words include pronouns like “he” or “she” as well as the character names if they were available in the dataset. If both male and female markers are present the sentence is not taken into account. Before running the sentiment analysis, the summaries were tokenized, the stopwords were removed and everything was lemmatized.
What are Tokenization, Stopword Removal and Lemmatization ?
When a text is tokenized it is split into individual tokens (≈words). In stopword removal all of the small words that do not add much information like “is” or “a” are removed. Lemmatization maps different versions of the same normalized words. For example, talking and talked would both become talk.
Now that we know how it works for one movie summary, let's take a look at the positivity score over all movies.
What makes a sentence positive ?
To determine the positivity of a sentence the words that are in that sentence are compared to standard lists of positive and negative words. The library Vader does this automatically.

The positive mentions are green, neutral gray and negative red. We can see that women tend to be described less negatively (50.3% vs. 59.8%), while men are associated with less positive sentences(35.8% vs. 41.3%). The remaining sentences are neutral. But we saw earlier that women tend to be more represented in Romance Films while men are the majority in Action Movies. Does this influence the results? We have identified movie genre as a possible confounder, so what do the sentiments look like in different genres?
What's a confounder ?
A confounder or confounding variable is a variable that influences both the variable that we are predicting and the variable that we are using to predict it. In observational studies, confounders can lead to wrong interpretations of the link between a variable and an outcome if they are not taken into account during data analysis.
Let's take a look at the stereotypical genres we saw earlier. Again, positive will be green, neutral gray and negative will be red. Firstly, Romance films:

The mentions of both genders in romance movies tend to be more positive (Male: 49.2% and Female: 53.4%), women still being described slightly more positively than men. Now we will a look at Action movies:

We can see that Action movies have a much higher percentage of negative sentences for both genders (Male: 73.5% and Female: 56.5%)! Our suspicions are confirmed, movie genres contribute a lot to the sentiment analysis outcomes. However, despite the percentages greatly shifted towards more positive or negative sentences for both genders depending on the movie genre, we observe similar trends as the ones observed for all movies: men seem to be described more negatively than women and women more positively than men.
Positivity depends on the genre, but what do the descriptions say about men and women ?


As we can see in the figures above the words “find”, “kill”, “go”, “take” and “tell” are the most popular no matter the gender they describe. Aside from that, we can see some differences but are they predictive of the gender?
Comparison of Most Predictive Words for each Gender
Below you can see the words that appear in movie descriptions with the highest probability of being associated with male gender in blue and the same for female words in pink. We have added the results for Romance and Action movies as well as one more genre present in the top 5 most represented genres in the dataset, which we assumed would be less stereotypical: Comedy.
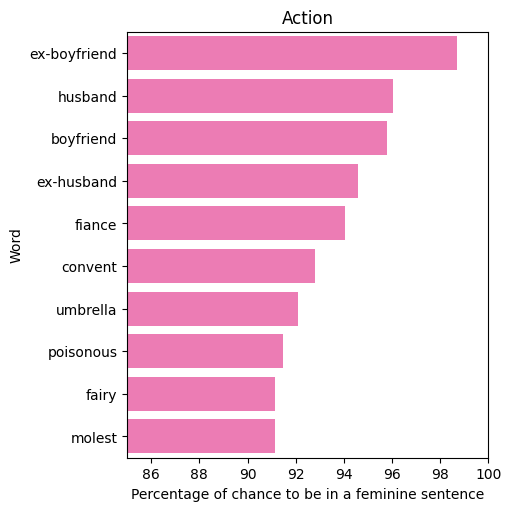
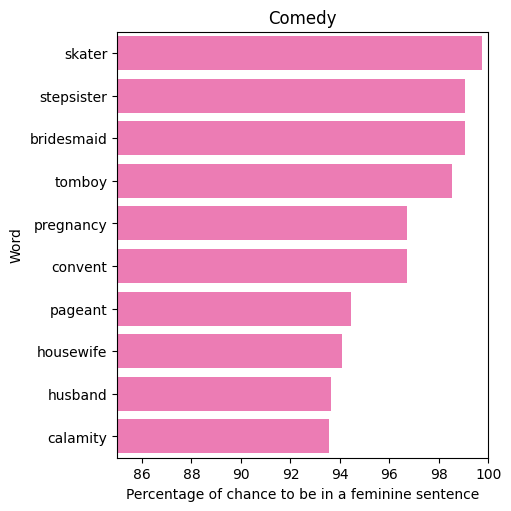
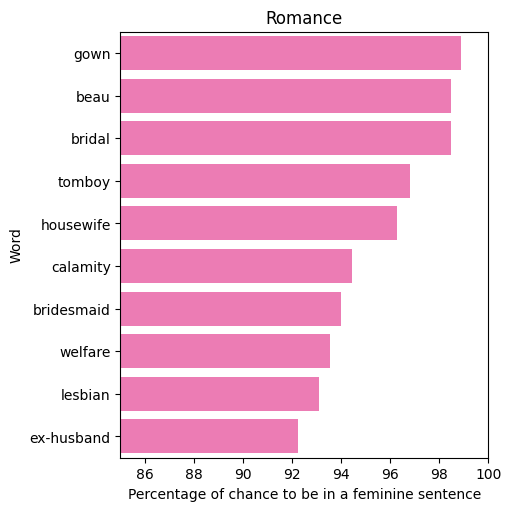
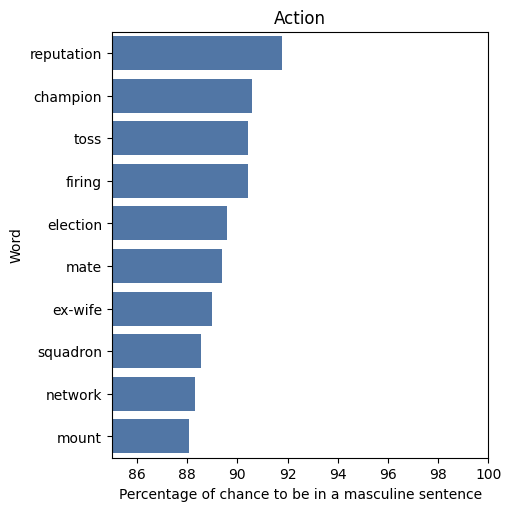
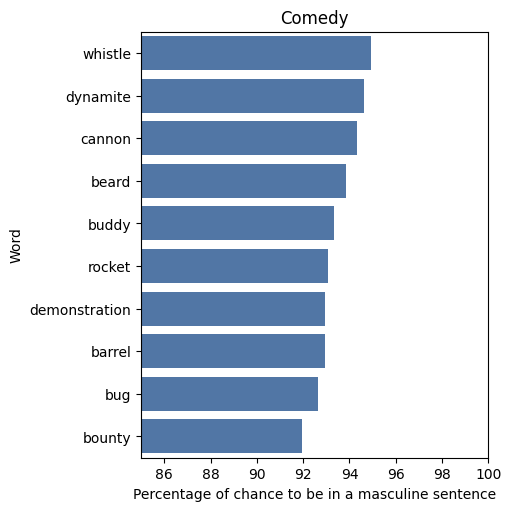
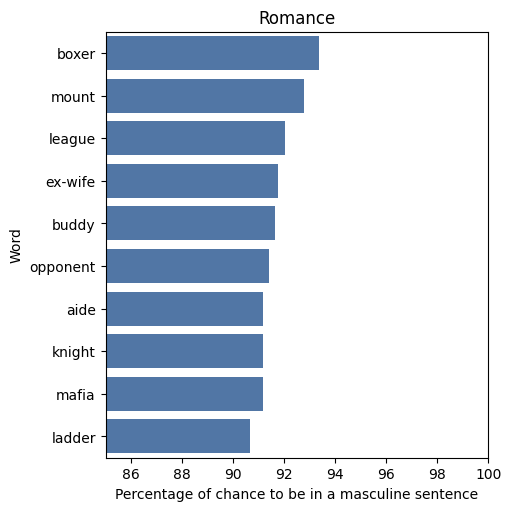
In an ideal world we would expect this result to show that words have about the same probability of being male or female but alas, we can conclude that we really did not need to label the gender on the graphs. The movie genres are much more difficult to guess than the gender. The words in female sentences tend to be connected with their relationships or reproduction, for instance “husband” or “pregnancy”, while the only words related to these topics in the male words are buddy and ex-wife. We also find stereotypical words in the topics of fame or heroism for men, such as “reputation” and “champion”, while women are associated with negatively stereotyped terms such as “molest”. In the female sentences the topic of wedding is very abundant, such as “bridesmaid”, “bridal” or “gown”. Overall, clichés we encounter in real life seem to be well established in movies as well!
But how will this make me more successful ?
To answer this question we will first have to take a look at how to define success. We decided to take both the revenue of the movie as well as the average rating of users into account. As suggested by the correlation of 0.23 the link between revenue and rating or budget and rating is very unclear, and the definition of success is thus very important. In the following we defined it as the revenue first, and then as the average rating.
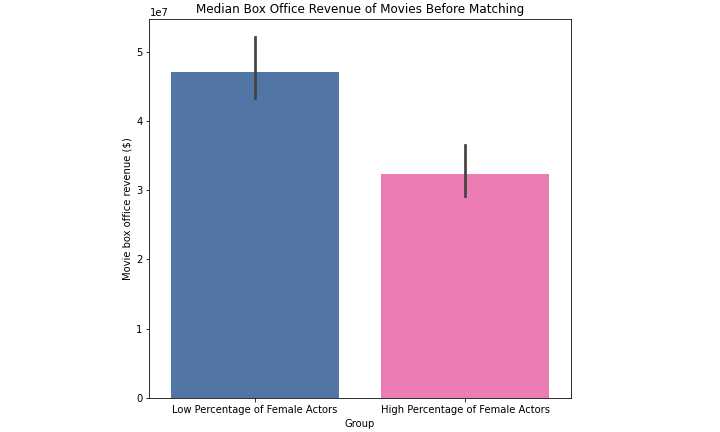
When comparing the median box office revenue of the first group (blue) representing movies with a low percentage of actresses and the second (pink) group that contains movies with a high percentage of actresses, we first observe that movies with less actresses seem to be more successful. The movies were categorized as low or high percentage of actresses if the fraction of female actors was at least 10% lower or higher than the average of 39% respectively.
But is the difference in gender ratio really responsible for the revenue being higher or lower?
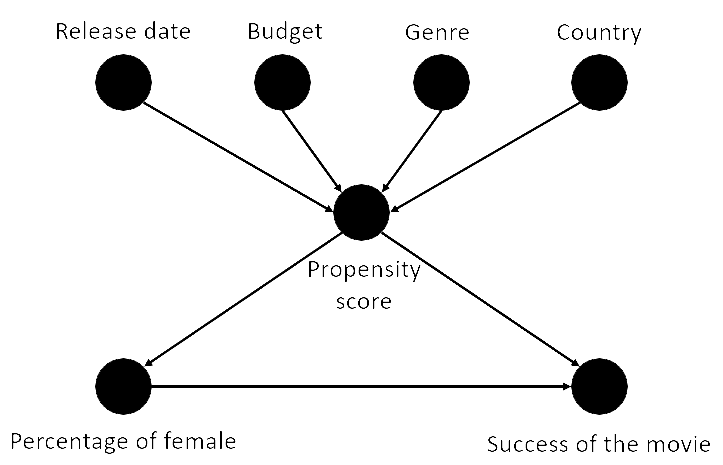
Many different factors could influence the success of a movie as we can see in the causal diagram on the right. As our dataset is a sample of movies and does not represent the whole movie population, it contains bias, for example the proportion of movies genres might not represent the real world genres proportion. To get rid of these confounders and bias, we performed a matching study.
What's matching ?
We all know not all movies are the same and a lot of factors could be influencing our results. To account for this, matching takes movies that are as similar as possible to each other except for the variable of interest (which is gender ratio here) and pairs them up so they can be compared to each other. But there are not many movies that are perfectly identical in everything except the percentage of female actors. To get around this we used what is called propensity scores. A propensity score is the probability based on the observed covariates (=Release date, Budget, Genre and Country) to be in the group with a higher percentage of female actors. The movies are then matched based on this score instead of the individual observed covariates.
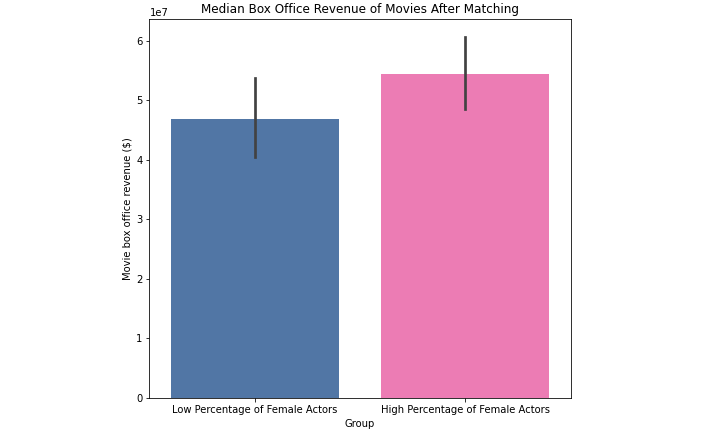
When performing a matching study where movies were matched between two groups based on release year, budget and movie genres, this made the gender balance the only remaining difference. Looking at these results that no longer depend on the confounders, we realize that there is an opposite trend: movies with high percentage of actresses seem to be more successful! However the difference is not statistically significant, so we cannot conclude from these results whether one group is more successful than the other.
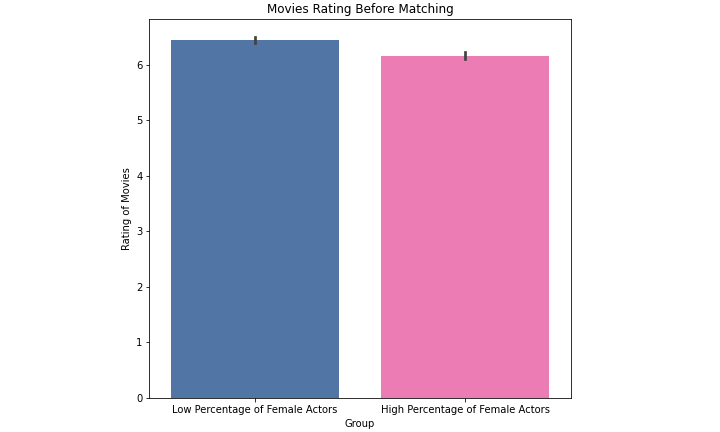
Looking at the unmatched data with the success metric rating we see that the movies with low percentage of female actors seem again rated higher.
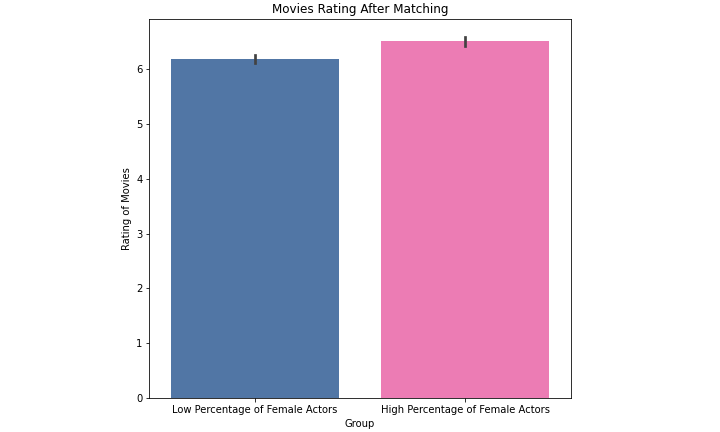
When we apply matching to the rating groups we were looking at we observe a similar result as with the revenue: The movies with more actresses are doing better! This time, there is a statistically significant difference, but the effect size is small.
Overall, we learned that it is very important to be careful when analyzing data since sometimes everything is not as it seems.
Outlook
We've seen that male and female actors are represented in very different numbers in movies and that there are vast differences across the genres. We've also seen that men are described more negatively and that women are mostly talked about in relation to their relationships or reproduction. Finally, we saw that more diverse movies don't necessarily make more money but might be rated higher among viewers.
To predict the genre the budget (typically 10 to 100 million dollars), the release year and the percentage of women in the film were used to make a regression. Finally, as you may know there is high variance in the revenue of films, which in our regression we interpreted as the consequence of the skills of your film production team which are represented by a score between -1 and 1. This predictor is implemented below.
We hope you have fun predicting film revenues!
Prediction example
Let's take the movie “Da Vinci Code” from 2006. This is a thriller with a budget of 125 million and a medium percentage of women. This author gives the movie a skill score of 0.7 since it is a great movie but is a poor adaptation of the book. The true revenue is 760 million dollars. Compare this to your prediction !
Revenue regression :
Movie type:
Movie budget (in M$):
Movie release year:
Percentage of women:
Skills:
Team

Pierre Ancey
Full-stack, Design & NLPComputationnal Science & Engineering | Math department

Bettina Weber
Story Teller & VisualizationLife Science Engineering | Life Sciences department

Sam Jegou
General AnalystComputationnal Science & Engineering | Math department

Alice
Story Teller & AnalystLife Science Engineering | Life Sciences department